If you haven’t yet checked out the Math Teachers at Play 58 blog carnival, do so now. My favorite post was this one, about plotting families of curves in Geogebra. Beautiful!

stolen right from his blog!

If you haven’t yet checked out the Math Teachers at Play 58 blog carnival, do so now. My favorite post was this one, about plotting families of curves in Geogebra. Beautiful!
stolen right from his blog!
Have you heard of the “The Incompatible Food Triad” problem? This was first introduced formally here by George Hart (father of the now famous Vi Hart). Here’s the statement, taken straight from his website:
Can you find three foods such that all three do not go together (by any reasonable definition of foods “going together”) but every pair of them does go together?
Hart’s page is full of various suggested solutions, most of which are shot down in one way or another. It’s obviously not a rigorous mathematical question, since much of the success of a solution depends on culturally-defined taste. But it still doesn’t stop us from trying solutions.

pictured above: chocolate and strawberries on a waffle, one suggested pairing. just don’t you dare also add peanut butter!!
Here’s mine. My wife and I sat down to have waffles one weekend and we think we discovered an Incompatible Food Triad: chocolate, strawberries, and peanut butter.
But we found that all three did not taste good together on a waffle. A quick web search reveals that people do sometimes eat these three things together, but not on a waffle.Let me make a slightly more rigorous statement of my suggestion then: I claim (chocolate AND waffle), (strawberries AND waffles), and (peanut butter AND waffles) are an incompatible food triad.
Can you see how this is not a very mathematical/scientific question? 🙂
Would you agree with our incompatible food triad? Do you have any other suggested solutions?

Have you checked out this amazing, zoomable application that allows you to get a feel for the scale of the universe? Go there now. I think I checked this out a year or two ago, but these kids have updated it recently.
That’s right, I did say kids. This cool app was designed and programmed completely by two high school students in California. ABC News has a nice article about them.
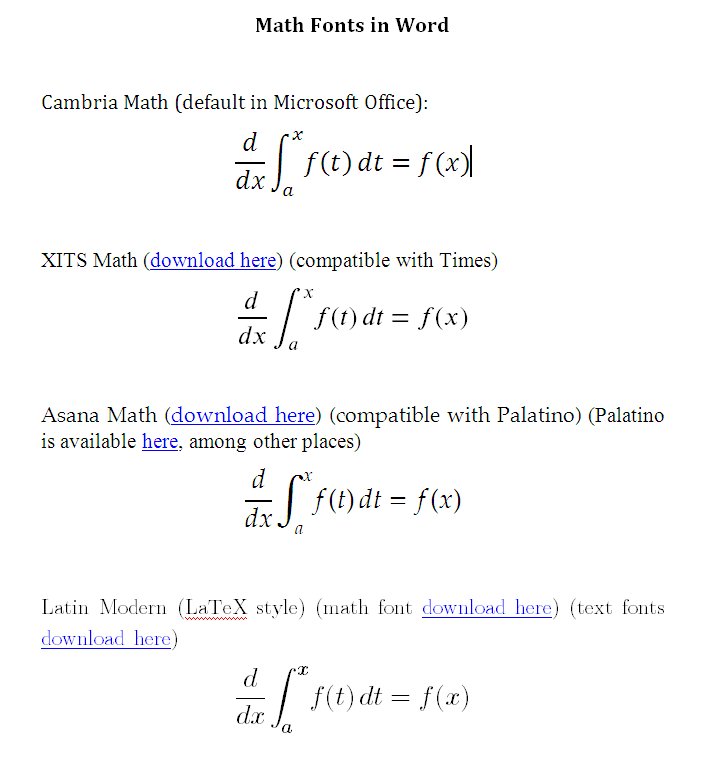
I was teaching tabular integration yesterday and as I was preparing, I was playing around with using it on integrands that don’t ‘disappear’ after repeated differentiation. In particular, the problem I was doing was this:
Now this is done pretty quickly with only one integration by parts:
Let 


But I decided to try tabular integration on it anyway and see what happened. Tabular integration requires us to pick a function 


If I did everything right, then the infinite series that appears in the formula must be equal to 

Wow!! That’s pretty wild. It seemed like any number of infinite series could pop up from this kind of approach (Taylor series, Fourier series even). In fact, they do. Here are just three nice resources I came across which highlight this very point. I guess my discovery is not so new.
I think I’ll show this to my Algebra 2 class this week.
[HT: Fred Connington]
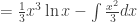
As you know, Microsoft Office has a new and improved Equation Editor that ROCKS. It is so quick and easy and comes with many benefits. Check out my previous posts on Equation Editor here, here, and here to see why it’s so great.
One issue everyone has with the new Equation Editor, however, is the limited ability to change the font typeface. The default that comes with word, Cambria Math, is nice but doesn’t suit everyone’s needs. If you’re typesetting a document with a font other than Cambria, then it looks a little weird to have your equations in a different font.
After some extensive research, I’ve found three other nice fonts that work with Microsoft Office’s new Equation Editor (these are compatible with Office 2007 or later):
To illustrate what these fonts look like, I’ve taken a screenshot below, and I’ve also uploaded the doc file and the pdf file. The doc file won’t render correctly on your machine, however, unless you actually download all the aforementioned fonts.
I hope this helps those who have been searching for alternative fonts for Microsoft Equation Editor. In the comments, please let me know if you find others!
Online Emulator
Check out this online TI-83 Plus emulator! This just came across my radar from Hackaday.

It requires that you upload a (legally acquired) rom, but once you do, this seems like it would be a very good ‘on-the-go’ resource for presentations, teaching, or just any other time and place when you might need at graphing calculator.
I don’t have a TI-83 plus rom lying around, and I tried a regular TI-83 rom (which I did happen to have) but it didn’t seem to work for me. Hmm.
Mobile Devices
[updated] I now recommend Wabbitemu as the best emulator on the computer and for Android devices. It accepts a very wide range of rom files and has a nice feature set. The whole process is pretty user friendly. Here’s a link to the app in the Google Play store and here’s their website where you can download the desktop app.
Another great emulator for Android is Andie Graph which can be obtained in the following way (instructions come from our student, Jim Best):
Jim also suggests this calculator if you have an Apple product:
There is an app that is a type of TI-83. It is called RK-83 on the app store for apple products such as the iPhone and iPod touch. This is a $0.99 app that has the same functionality as a TI-83. It does not have the best of reviews but for $0.99, its worth a shot. There is also an app by the same creator that has better reviews but it is an 89.
Of course, there are scads of other great calculators out there if you’re willing to give up the look and feel of the TI experience. Desmos is a popular choice and works nicely on all platforms but isn’t a powerhouse of a calculator.
Plain-old Software
And as far as plain-old desktop software goes, here are some great emulators:
I actually prefer the Wabbitemu and Rusty Wagner emulators to the TI-SmartView emulator, even though our school has purchased copies for all of the math teachers.
Rom Files
In almost all the above cases, you’ll need to obtain a rom file for the calculator you’re interested in emulating. This is like the brains of the calculator. The emulator is just the pretty buttons and interface that run on top of the rom.
To obtain the rom file for your calculator, follow the instructions at ticalc.org here. I actually preferred using the instructions here for my TI-84 Plus SE. You can create your own rom file, or you can try to hunt for a download somewhere. This page has a bunch of downloads, but it’s not comprehensive. Remember that, legally, you must own the physical calculator if you download and use one of these rom files.

AP Calculus is often seen as the pinnacle of the high school mathematics curriculum*–or the “summit” of the mountain as Professor Arthur Benjamin calls it. Benjamin gave a compelling TED talk in 2009 making the case that this is the wrong summit and the correct summit should be AP Statistics. The talk is less than 3 minutes, so if you haven’t yet seen it, I encourage you to check it out here and my first blog post about it here.
I love Arthur Benjamin and he makes a lot of good points, but I’d like to supply some counter-points in this post, which I’ve titled “Why Calculus still belongs at the top.”
Full disclosure: I teach AP Calculus and I’ve never taught AP Statistics. However I DO know and love statistics–I just took a grad class in Stat and thoroughly enjoyed it. But I wouldn’t want to teach it to high school students. Here’s why: For high school students, non-Calculus based Statistics seems more like magic than mathematics.
When I teach math I try, to the extent that it’s possible, to never provide unjustified statements or unproven claims. (Of course this is not always possible, but I try.) For example, in my Algebra 2 class I derive the quadratic formula. In my Precalculus class, I derive all the trig identities we ask the students to know. And in my Calculus class, I “derive” the various rules for differentiation or integration. I often tell the students that copying down the proof is completely optional and the proof will not be tested–“just sit back and relax and enjoy the show!”
But such an approach to mathematical thinking can rarely be applied in a high school Statistics course because statistics rests SO heavily on calculus and so the ‘proofs’ are inaccessible. I’d like to make a startling claim: I claim that 99.99% of AP Statistics students and 99% of AP Statistics teachers cannot even give the function-rule for the normal distribution.

Image used by permission from Interactive Mathematics. Click the image to go there and learn all about the normal distribution!
In what other math class would you talk about a function ALL YEAR and never give its rule? The normal distribution is the centerpiece (literally!) of the Statistics curriculum. And yet we never even tell them its equation nor where it comes from. That should be some kind of mathematical crime. We might as well call the normal distribution the “magic curve.”
Furthermore, a kid can go through all of AP Statistics and never think about integration, even though that’s what their doing every single time they look up values in those stat tables in the back of the book.
I agree that statistics is more applicable to the ‘real world’ of most of these kids’ lives, and on that point, I agree with Arthur Benjamin. But I would argue that application is not the most important reason we teach mathematics. The most important thing we teach kids is mathematical thinking.
The same thing is true of every other high school subject area. Will most students ever need to know particular historical facts? No. We aim to train them in historical thinking. What about balancing an equation in Chemistry? Or dissecting a frog? They’ll likely never do that again, but they’re getting a taste of what scientists do and how they think. In general, two of our aims as secondary educators are to (1) provide a liberal education for students so they can engage in intelligent conversations with all people in all subject areas in the adult world and (2) to open doors for a future career in a more narrow field of study.
So where does statistics fit into all of this? I think it’s still worth teaching, of course. It’s very important and has real world meaning. But the value I find in teaching statistics feels VERY different than the value I find in teaching every other math class. Like I said before, it feels a bit more like magic than mathematics.**
I argue that Calculus does a better job of training students to think mathematically.
But maybe that’s just how I feel. Maybe we can get Art Benjamin to stop by and weigh in!
.
….
*In our school, and in many other schools, we actually have many more class options beyond Calculus for those students who take Calculus in their Sophomore or Junior year and want to be exposed to even more math.
** Many parts of basic Probability and Statistics can be taught with explanations and proof, namely the discrete portions–and this should be done. But working with continuous distributions can only be justified using Calculus.
Check out this pretty music! [ht: Prisca Chase]
I’ve been taking a grad course in statistics this semester and so I’ve been thinking about all sorts of real world examples of math, including the classic product-failure example that’s a mainstay of most stat classes.
One of the simplest continuous distributions is the exponential distribution which is a pretty decent way to model product failures. The probability of failure 


I read this great article about product failure and testing in Wired this week. I encourage you to check it out. Read the last page of the article especially, where it talks about how cutting-edge companies are modeling minute variations in materials using an electron microscope and some statistics. Instead of actually testing the product over and over again using a fatigue machine, they can create surprisingly accurate models of the materials using computers. Prior to this, the behavior of materials was somewhat unpredictable.
Of course I was excited to see this figure in the article, which shows the Weibull distribution modeling failures of steel bars in a fatigue machine.

The Weibull distribution, unlike the exponential distribution, takes the age of a product into account. If the parameter 
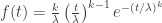
The first obvious thing to note is that the exponential distribution is just a special case of the Weibull distribution, with 
[pun warning!]
The real question is, if this is TWO Weibulls, would you settle for the lesser of two Weibulls?
Sorry. I had to.