
I’ve been taking a grad course in statistics this semester and so I’ve been thinking about all sorts of real world examples of math, including the classic product-failure example that’s a mainstay of most stat classes.
One of the simplest continuous distributions is the exponential distribution which is a pretty decent way to model product failures. The probability of failure 


I read this great article about product failure and testing in Wired this week. I encourage you to check it out. Read the last page of the article especially, where it talks about how cutting-edge companies are modeling minute variations in materials using an electron microscope and some statistics. Instead of actually testing the product over and over again using a fatigue machine, they can create surprisingly accurate models of the materials using computers. Prior to this, the behavior of materials was somewhat unpredictable.
Of course I was excited to see this figure in the article, which shows the Weibull distribution modeling failures of steel bars in a fatigue machine.

The Weibull distribution, unlike the exponential distribution, takes the age of a product into account. If the parameter 
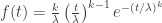
The first obvious thing to note is that the exponential distribution is just a special case of the Weibull distribution, with 
[pun warning!]
The real question is, if this is TWO Weibulls, would you settle for the lesser of two Weibulls?
Sorry. I had to.

Lesser of two Weibulls? That’s just not NORMAL. I should CHIde you for that one.