A Calculus textbook should seem like fun, right? I think so!
 [Hat tip: my dad]

A Calculus textbook should seem like fun, right? I think so!
 [Hat tip: my dad]
I just ordered this book. I’m excited to see what it’s like. And of course, I’ll be sure to let you know how it is!

Dr. Robert Ghrist, professor of mathematics at U Penn is writing a Calculus text–the Funny Little Calculus Text (FLCT for short). The FLCT not your typical Calculus text. Check out his incredible, artistic, funny, and mathematically elegant work-in-progress here. He currently has completed these short little chapters, all of which are a delightful read:
Ghrist lectures in a similar style, with a tablet PC. And yes, his handwriting is really awesome.
NOTE: I’m updating this post today (1-10-2013) because I’ve just noticed that Ghrist has placed these files behind a (very low) pay-wall. They are STILL worth checking out!! Pay for them for goodness sake! 🙂
Today we had a “Tower of Terror” competition in our Calculus classes (just for Halloween fun :-)). The rules are: You get 5 pieces of 8.5″x11″ paper and 8″ of masking tape. The goal is to build the tallest free-standing tower.
Here’s a photo of the best tower from all the classes, standing at an amazing 57″. Great job, ladies!

The first week of school I gave this problem and never came back to it:
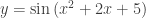
Find the range of 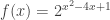

The answer is 
First consider the range of the quadratic in the exponent, 


Now, consider the function 


Do you feel “at home on the range”?
Here are a few more for you to try. In each case, find the range of the function. These aren’t meant to be any harder than the original problem, just different. Though watch out for the third one :-).
Before I get to the titular topic, let me share some links. I’ve been meaning to post links to a couple of online resources that are astonishingly thorough. I strongly encourage you to check all these out.
Math Teaching by Video
Some of these sites, especially the Khan Academy, make me wonder how long our modern American school system will remain in its present form. Will we always have a teacher in the front of the math classroom delivering instruction?
I’m not afraid of the idea that we (teachers) could be partially replaced by video lessons. It’s actually a pretty good idea. The very best instructional practices could be incorporated into a flawlessly edited video. Teachers wouldn’t make frustrating, careless mistakes, students could replay the videos at any time, and substitute teachers could easily run the class. Every school, even the poorest and most marginalized would be able to deliver top-notch, world class instruction.
And what would teachers do, then? Qualified teachers could turn their efforts toward more of “coaching” and “discussion leading” role, concentrating on one-on-one sessions, remediation, reteaching, providing feedback, grading, seminars, open forums, field trips, and inquiry-based instruction that supplements the more formal video presentations. And don’t forget blogging! 🙂 So much of a teacher’s time is currently spent preparing lessons and teaching them that they have very little time for all those other (more?) important aspects of teaching. All this time devoted to preparation is being spent by teachers everywhere. Imagine the possibilities if we devoted the bulk of our time to these other aspects instead of preparing instruction. Sounds really great to me.
I’m always on the look out for nice java applets (or flash, or javascript, or whatever) that help visualize tough math concepts. The best applets are not merely gimmick, but truly make the mathematics more accessible and invite you to explore, predict, and play with the concepts.

Most recently, my dad pointed me to this website. At this site, you’ll find well over one hundred very nice applets that show things I haven’t seen around the web before. For instance, play around with your favorite polyhedra in 3d, then let the applet truncate or stellate the polyhedron, all with nice animation. And of course, you’ll want to mess with all the settings on the drop down menus, too! Additionally, you can see a mobius strip, klein bottle, cross cap, or a torus. Also, I was just recently blogging about complex functions. Some of these applets allow you to visualize with animation and color various complex functions. Having just completed a grad class in differential equations, I was also interested in these ODE applets. You may also have fun with fractals, like this one.
There are lots of other nice applet websites out there. As you know, I’m a huge fan of GeoGebra (free, open source, able to be run online without installation, easy to use, powerful). Someday maybe I’ll post more extensively about its merits. In the meantime, you can check it out here. Many of these applets use GeoGebra. This site has a lot of nice applets too. And here. This one’s rather elementary, but fun for educators. These are great, too. These are all sites I’ve used in class. Like I said, I think they’re more than just ‘cool’–they really do help elucidate hard-to-understand topics.
Feel free to share other applet sites you like.
This goes out to my Calculus class. Enjoy! 🙂
I’m currently taking a grad class in differential equations. I just had a homework problem that asked about the heat conduction in a long, thin rod. It inspired me to create another GeoGebra applet, and I thought I’d share. The math might be a bit inaccessible, but the results are fairly straightforward.

Consider a solid rod of some kind of uniform material (maybe aluminum or cast iron). Say it’s 20 cm long. And say, for whatever reason, the temperature at a given place in the bar is initially given by this distribution:

Notice the bar is 70 degrees at each end and 50 degrees in the middle. (This is arbitrary…I just picked this distribution, just for fun.)
Now, let’s say the sides of the bar are insulated, and we just apply heat to the ends. If we maintain a temperature of 10 degrees at one end and 50 degrees at the other end, after a long time, we would expect the temperature throughout the bar to be evenly distributed, ranging from 10 degrees to 50 degrees. It would look something like this:
Now, the question is, what is the temperature throughout the bar after 1 second? It should be pretty close to the original distribution still, right? Right. What about after 10 seconds? 30 seconds? 30 days? Eventually it will look like the above distribution. That’s why we call this the “steady-state” distribution.
Here’s what the temperature throughout the bar looks like after 30 seconds, for instance.

Notice that the temperature distribution is still very similar to the initial distribution, but that the ends are changing temperature. This will happen more and more over time.
The applet I constructed lets you change everything about this situation: the length of the bar, the type of material, the temperature we apply to each end, and the initial temperature distribution. Like I said, the math is a bit nasty, but the results are intuitive, I hope. If you want to see some more of the math, feel free to do some reading!