Want to enrich your Precalculus course with difficult problems? Look no further!
I teach a high-octane version of Precalculus to students in our magnet program. Our course, like most Precalculus courses, covers a very wide variety of topics. As often as possible, I like to give them more difficult problems that enrich the material from the book. These documents are a work in progress, but feel free to steal them (just email me a copy if you improve them!):
If you want solutions for any of these, shoot me an email.
These aren’t 100% polished by any means, but I’m sharing them anyway! Long live the spirit of sharing :-).
By the way, many of these problems are collected from other sources but I’m too far removed from those sources to properly attribute the problem-creator. My sincere apologies!
Here’s another Quora answer I’m reposting here. This is the question, followed by my answer.
What does the value of a point on the normal distribution actually represent, if anything?
It’s important to note the difference between discrete and continuousrandom variables as we answer this question. Though naming conventions vary, I think most mathematicians would agree that a discrete random variable has a Probability Mass Function (PMF) and a continuous random variable has a Probability Density Function (PDF).
The words mass and density go a long way in helping to capture the difference between discrete and continuous random variables. For a discrete random variable, the PMF evaluated at a certain gives the probability of . For a continuous random variable, the PDF at a certain does not give the probability at all, it gives the density. (As advertised!)
So what is the probability that a continuous random variable takes on a certain value? For example, assume a certain type of fish has length that is normally distributed with mean 22 cm and standard deviation 1.6 cm. What is the probability of selecting a fish exactly 26 cm long? That is, what is ?
The answer, for any continuous random variable, is zero. More formally, if is a continuous random variable with support , then for all .
For the fish problem, this actually does make sense. Think about it. You pull a fish out of the water which you claim is 26 cm long. But is it really 26 cm long? Exactly 26 cm long? Like 26.00000… cm long? With what precision did you make that measurement? This should explain why the probability is zero.
If instead you want to ask about the probability of getting a fish between 25.995 and 26.005 cm long, that’s perfectly fine, and you’ll get a positive answer for the probability (it’s a small answer :-).
Let’s return to the words mass and density for a second. Think about what those words mean in a physics context. Imagine having a point mass–this is in an ideal case–then the mass of that point is defined by a discrete function. In reality, though, we have density functions that assign a density to each point in an object.
Think about a 1-dimmensional rod with density function . What is the mass of this rod at ? Of course, the answer is zero! This should make intuitive sense. Of course, we can get meaningful answers to questions like: What is the mass of the rod between and ? The answer is .
Does the physical understanding of mass vs density clear things up for you?
In an effort to share more of my resources through this blog, here’s another installment.
This time I’m sharing a little worksheet that I created called Guess Who? It’s a short activity–a warm up, or an exit card–and students should be able to do it in 5 minutes or so. I do this in my Precalculus class at the beginning of the year, but depending on the timing and the context, it could be appropriate in an Algebra 2 or Calculus class as well.
The functions and the questions have a one-to-one correspondence and there is a unique solution to the worksheet.
These 12 functions might seem a bit strange, but they are the “12 basic functions” named by our Precalculus textbook authors.
Here are two additional activities that can go with a discussion of functions and their properties:
I have all the functions printed out on 8.5″x11″ paper and backed with colored paper so they look nice. I get twelve volunteers to go up to the front and hold the functions. Then we can play all sorts of games. We can ask all the functions that have an asymptote to step forward. We can ask all the odd functions to step forward. Which functions are bounded? Which functions are always increasing? Which functions have a range of all real numbers? But we can also play a guessing game: A student in the audience picks a function and writes it down without telling everyone. The other students in the audience ask yes-no questions about their function, like “Is your function continuous for all real numbers?” Each time, functions that don’t qualify step back and only a few functions remain. This is repeated until the chosen function is the only one that remains.
Another fun game idea comes from one of my colleagues. I love this: Have a bunch of “name tags” made up for all your students. The name tags will be one of the 12 basic functions and students will wear these on their backs, without knowing what their function is. They then have to walk around the room and ask other students yes-no questions about the features of their function until they can identify which function they are. I think I’ve played a version of this with celebrities or something. But it’s perfect for the math classroom, too!
Okay, that’s my contribution to the MTBoS for the day :-).
Anyone who has been in math classes knows those corny worksheets with a joke on them. When you answer the questions, the solution to the (hilarious) joke is revealed. Did I mention these worksheets are corny? But when you get to Calculus or higher math classes, you get nostalgic for those old pre-algebra worksheets your middle school teacher gave you. I think I speak for all of us when I say this.
Not to fear, here’s a very corny joke worksheet I made just for your Calculus students. Print this on orange paper and hand it out on Halloween. When kids successfully solve the problems and discover the solution, give them candy.
PS: I normally use my blog to share deep insights about math education or to discuss interesting higher level mathematics. But I was inspired to share more of my day-to-day activities and worksheets because of Rebecka Peterson at Epsilon-Delta. She has shared some great resources, which I’ve stolen in used in my classroom. Thanks, Rebecka!
But if you were on a desert island without access to Wolfram Alpha, here’s how you might think it through:
Are you already comfortable with the Binomial Theorem? Here it is again, but stated in a particular way that I think we’ll like.
Look at it and make sure you understand it, and verify that it really is equivalent to the formulation of the Binomial Theorem you know.
Now, for the big trick. It turns out the above statement holds true not for just but for all real . The only catch is that this often results in an infinite series. (These series results can also be obtained by Taylor expansion.)
In particular, it works for :
Now, rewriting your original expressionas gives
which is the same result Wolfram Alpha will spit back.
In the following article, I expand and clarify my arguments that first appeared in this post.
A colleague recently sent me another article (thanks Doug) claiming that Statistics should replace Calculus as the most important math class for high school students.
Which peak to climb? (CCL, click on image for source)
The argument usually goes: Most kids won’t use Calculus. Statistics is more useful.
As you might know already, I disagree that the most important reason for teaching math is because it is useful. I don’t disagree that math is useful. Math is not just useful, but essential for STEM careers. So “usefulness” is certainly one reason for teaching math. But I don’t think it’s the most important reason for teaching math.
The most important reason for teaching math is because it is beautiful and eternal. Math is the single place in school where students can find deductive certainty and eternal truth. Even when human activity ceases, math will persist. When we study math, we tap into something bigger than ourselves. We taste the divine!
We are teaching students to think deductively—like a mathematician would. This is such an important area of knowledge for students to explore. They need to know what it means to prove something. A proof provides a kind of truth that is unattainable in other subjects, even the hard sciences. At best, the scientific method is still just guesses compared to math.
This is the most important thing we pass on to our students. Though some will, most of our students will not directly use the math we teach. This is actually true about every subject in high school. Most students will not remember the details of The Great Gatsby or remember the chemical formula for Ammonium Nitrate. But we do hope they learn the bigger skills: analyzing text and thinking scientifically. In math, the “bigger skills” are the ones I outlined above—proof, logic, reasoning, argumentation, problem solving. They can always look up the formulas.
Math is a subject that stands on its own and it is not the servant of other subjects. If we treat math as simply a subject that serves other subjects by providing useful formulas, we turn math into magic. We don’t need to defend math in this way. It stands on its own!
Calculus = The Mona Lisa
If students can take both Statistics and Calculus, that is ideal. But if I had to choose one, I would pick Calculus. The development of “the Calculus” is one of the great achievements of mankind and it’s a real crime to go through life never having been exposed to it. Can you imagine never having seen The Mona Lisa? Calculus is like the Mona Lisa of mathematics :-).
I’ve been meaning to give the back wall of my classroom a makeover for a while. This summer I finally found some time to tackle the big project. I took down all the decorations and posters. I fixed up the wall and painted it a nice tan color. Then, I let loose the randomness!
I struggled with what the new mural would be–I’ve thought about it over the last few years. I considered doing some kind of fractal like the Mandelbrot Set. But it should have been obvious, given the name of my blog!! What you see in the picture above is three two-dimensional random walks in green, blue, and red. In the limiting case, one gets Brownian motion:
Brownian motion of a yellow particle in a gas. (CCL)
I honestly didn’t know what it was going to look like until I did it. I generated it as I went, rolling a die to determine the direction I would go each time. I weighted the left and right directions because of the shape of the wall (1,2=right; 3,4=left; 5=up; 6=down). For more details about the process of making it, here’s a documentary-style youtube video that explains all:
Actually, I lied–it doesn’t tell “all.” If you really want to know more of my thought process and some of the math behind what I did, watch the Extended Edition video which has way more mathematical commentary from me. I’ve also posted the time lapse footage of the individual green, blue, and red. Just for fun, here’s an animated random walk with 25,000 iterations:
A two-dimensional random walk with 25,000 iterations. Click the image for an animated version! (CCL)
I think the mural turned out pretty well! It was scary to be permanently marking my walls, not knowing where each path would take me, or how it would end up looking. At first I thought I would only do ONE random walk. However, the first random walk (in blue) went off the ceiling so I stopped. And then I decided to add two more random walks.
In retrospect, it actually makes complete sense. I teach three different courses (Algebra 2, Precalculus, and Calculus) and I’ve always associated with each of theses courses a “class color”–green, blue, and red, respectively. I use the class color to label their bins, to write their objective and homework on the board, and many other things.
The phrase “Where will mathematics take you?” was also a last-minute addition, if you can believe it. There just happened to be a big space between the blue and red random walks and it was begging for attention.
What a good question for our students. The random walks provide an interesting analogy for the classroom. I’d like to say I’m always organized in my teaching. But some of the richest conversations come from a “random walk” into unexpected territory when interesting questions are raised.
Speaking of interesting questions that are raised, here are a few:
Can you figure out how many iterations occurred after looking at a “finished” random walk? Or perhaps a better question: What’s the probability that there were more than n iterations if we see m line segments in the random walk?
Given probabilities of going in the four cardinal directions, can we predict how wide and how high the random walk will grow after n iterations? Can we provide confidence intervals? (might be nice to share this info with the mural creator!)
After looking at a few random walks, can we detect any bias in a die? How many random walks would want to see in order to confidently claim that a die is biased in favor of “up” or “left”…etc?
Some of the questions are easy, some are hard. If you love this stuff, you might be interested in taking a few courses in Stochastic Processes. Any other questions you can think of?
Where will math take you this coming academic year? Welcome back everyone!
Confession: I still haven’t figured out how to use twitter. (Feel free to follow me @mrchasemath, though!) I always feel like I’m drinking from a fire hose when I get on the site–I can’t keep up with the twitter feed, so I don’t even try.
But when I do, I love seeing what people are posting. Here’s a great math problem from James Tanton. He always has such interesting problems!
Starting with zero I flip a coin. If H I add 1, if T I add 2. Repeat. What is probability I will see the number ten in my running sum?
@jamestanton@JosephLillo notice from the explicit formula that the probability of seeing the sum n converges to ⅔ as n → ∞ — John Chase (@mrchasemath) April 27, 2014
It’s hard to do math with 140 characters! 🙂
Here’s his follow-up question which has still gone unanswered. My approach to the first problem won’t work here, and I want to avoid brute-forcing it. (Reminds me of my last post!) Any ideas?
Starting with zero, I roll a die and add on value I see, and repeat, to create a running sum. What is probability 7 appears in that sum? 13?
I have a guest blog post that appears on the White Group Mathematics blog here. (My first guest post!) Here’s a taste:
One thing I love about math, and particularly combinatorics and probability, is the fact that many methods exist for solving the same problem.
Each method may have its advantages. The advantage might be conceptual (as in “this makes most sense to me”) or the advantage might be computational (as in “this is the fastest way to do it”).
Discussing the merits of different methods is exactly what math class is for!
For example, check out this typical probability question that could appear in a Precalculus course:
The Texas Ranger pitching staff has 5 right-handers and 8 left-handers. If 2 pitchers are selected at random to warm up, what is the probability that at least one of them is a right-hander?
In fact, it’s one I use in my own Precalculus course and it generated a great class discussion. In teaching it this past year, I ended up showing students four ways to do the problem this year! Here they are…
These are one-hour talks, complete with refreshments, all for free due to the generous sponsorship of the NSA. The talks are at the Carriage House, at the MAA headquarters near Dupont Circle.
Here are some of the great talks that are on the schedule in the next few months (I’m especially excited to hear Francis Su on May 14th).
I’ve been to many of these lectures and always enjoyed them. Robert Ghrist‘s lecture was out of this world (here’s the recap, but no video, audio, or slides yet) and was so very accessible and entertaining, despite the abstract nature of his expertise–algebraic topology.
And that’s the wonderful thing about all these talks: Even though these are very bright mathematicians, they go out of their way to give lectures that engage a broad audience.
Here’s another great one from William Dunham, who spoke about Newton (Dunham is probably the world’s leading expert on Newton’s letters). Recap here, and a short youtube clip here:

 I teach a high-octane version of Precalculus to students in our magnet program. Our course, like most Precalculus courses, covers a very wide variety of topics. As often as possible, I like to give them more difficult problems that enrich the material from the book. These documents are a work in progress, but feel free to steal them (just email me a copy if you improve them!):
 ?
? or
or
 but what about
  aka.
aka. 
-\frac{1}{8}\left(\frac{a}{b}\right)^2+\frac{1}{16}\left(\frac{a}{b}\right)^3+\cdots\right)")


 of going in the four cardinal directions, can we predict how wide and how high the random walk will grow after n iterations? Can we provide confidence intervals? (might be nice to share this info with the mural creator!)
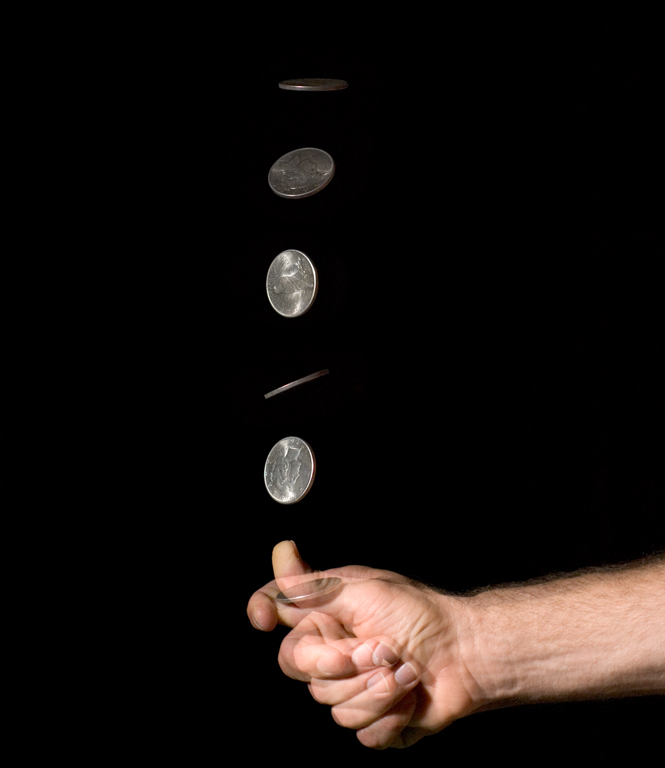

 Here
Here